Unit 2 - EDA Tutorial
Exploratory Data Analysis Tutorial
This tutorial demonstrates the process of Exploratory Data Analysis (EDA) using the Auto-mpg dataset. The analysis includes data loading, cleaning, visualization, and statistical analysis to understand the relationships between different variables.
Data Loading and Initial Exploration
Loading the Dataset
import pandas as pd
import numpy as np
# Load the dataset
df = pd.read_csv('auto-mpg.csv')
# Display first few rows
print(df.head())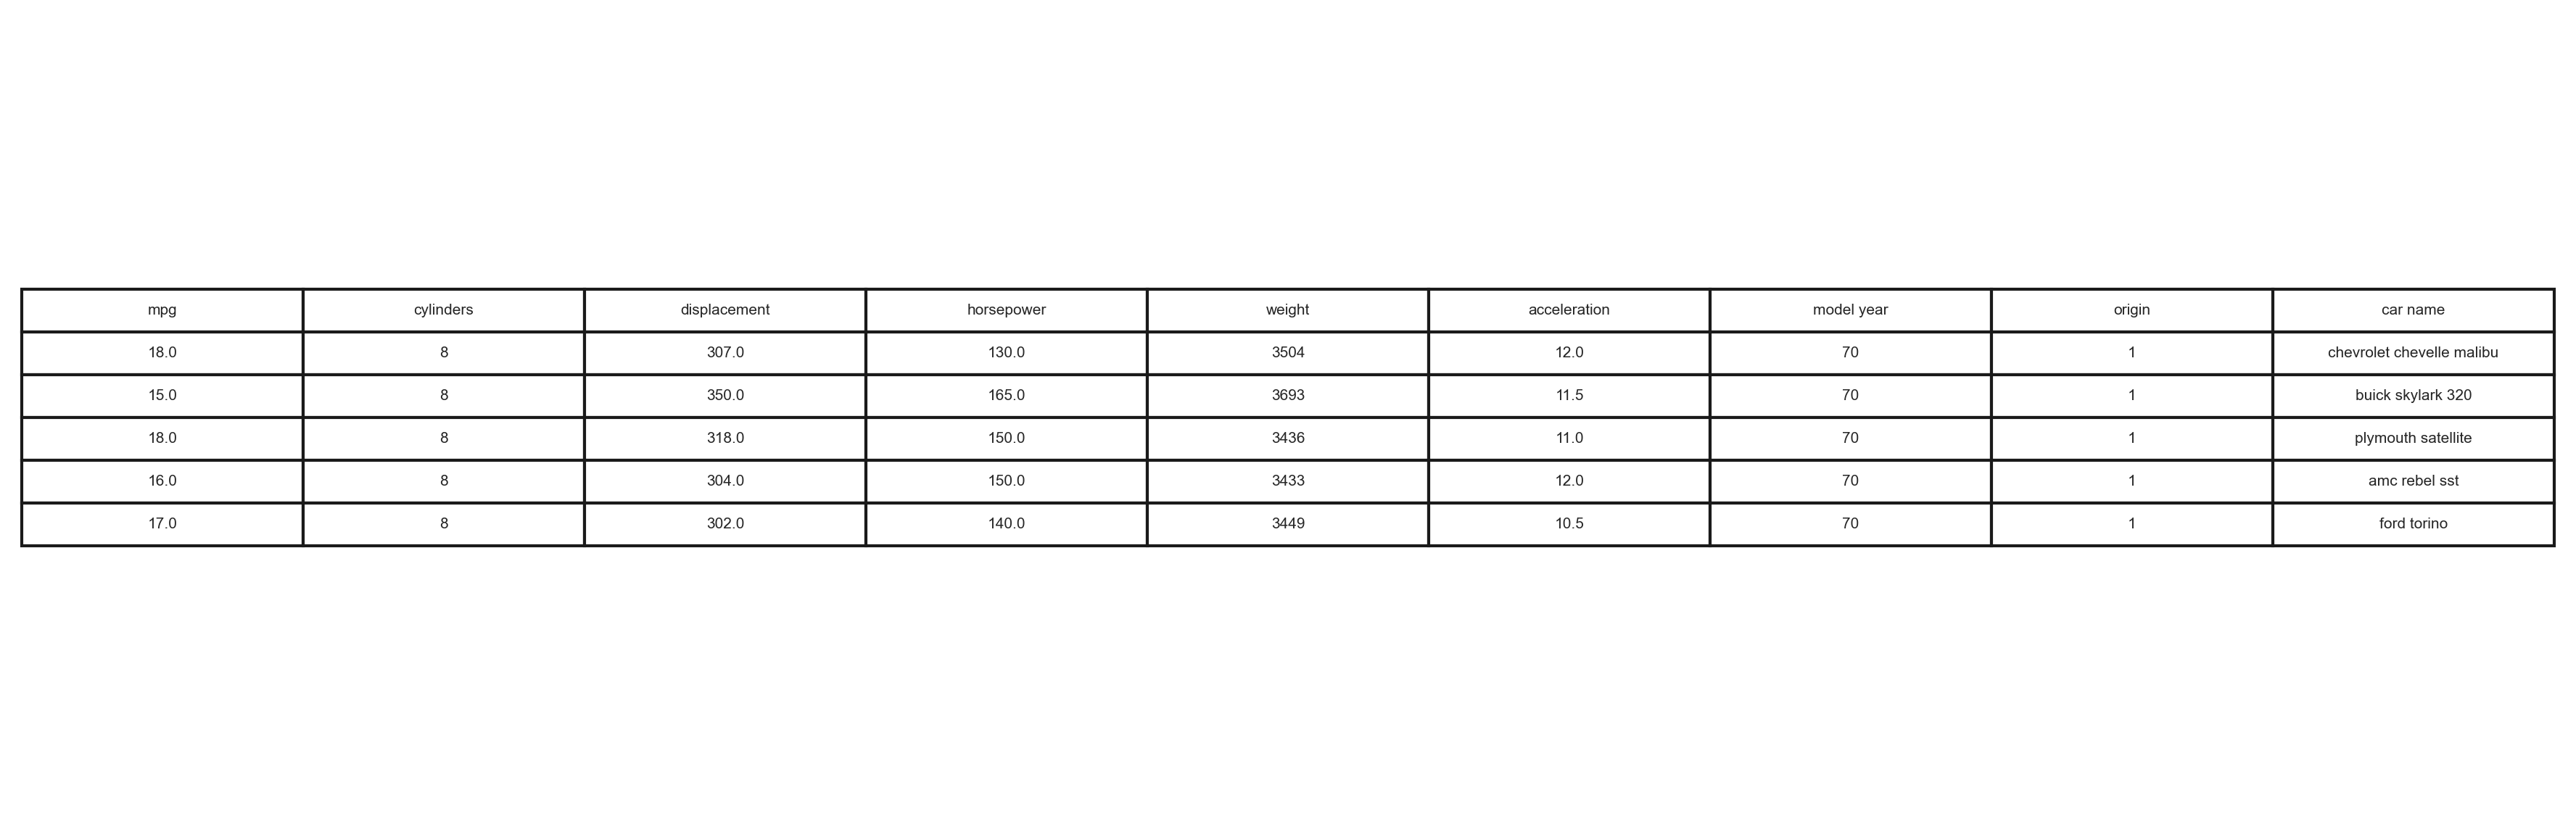 First few rows of the Auto-mpg dataset
Missing Values Analysis
Checking for Missing Values
# Check for missing values
missing_values = df.isnull().sum()
print(missing_values)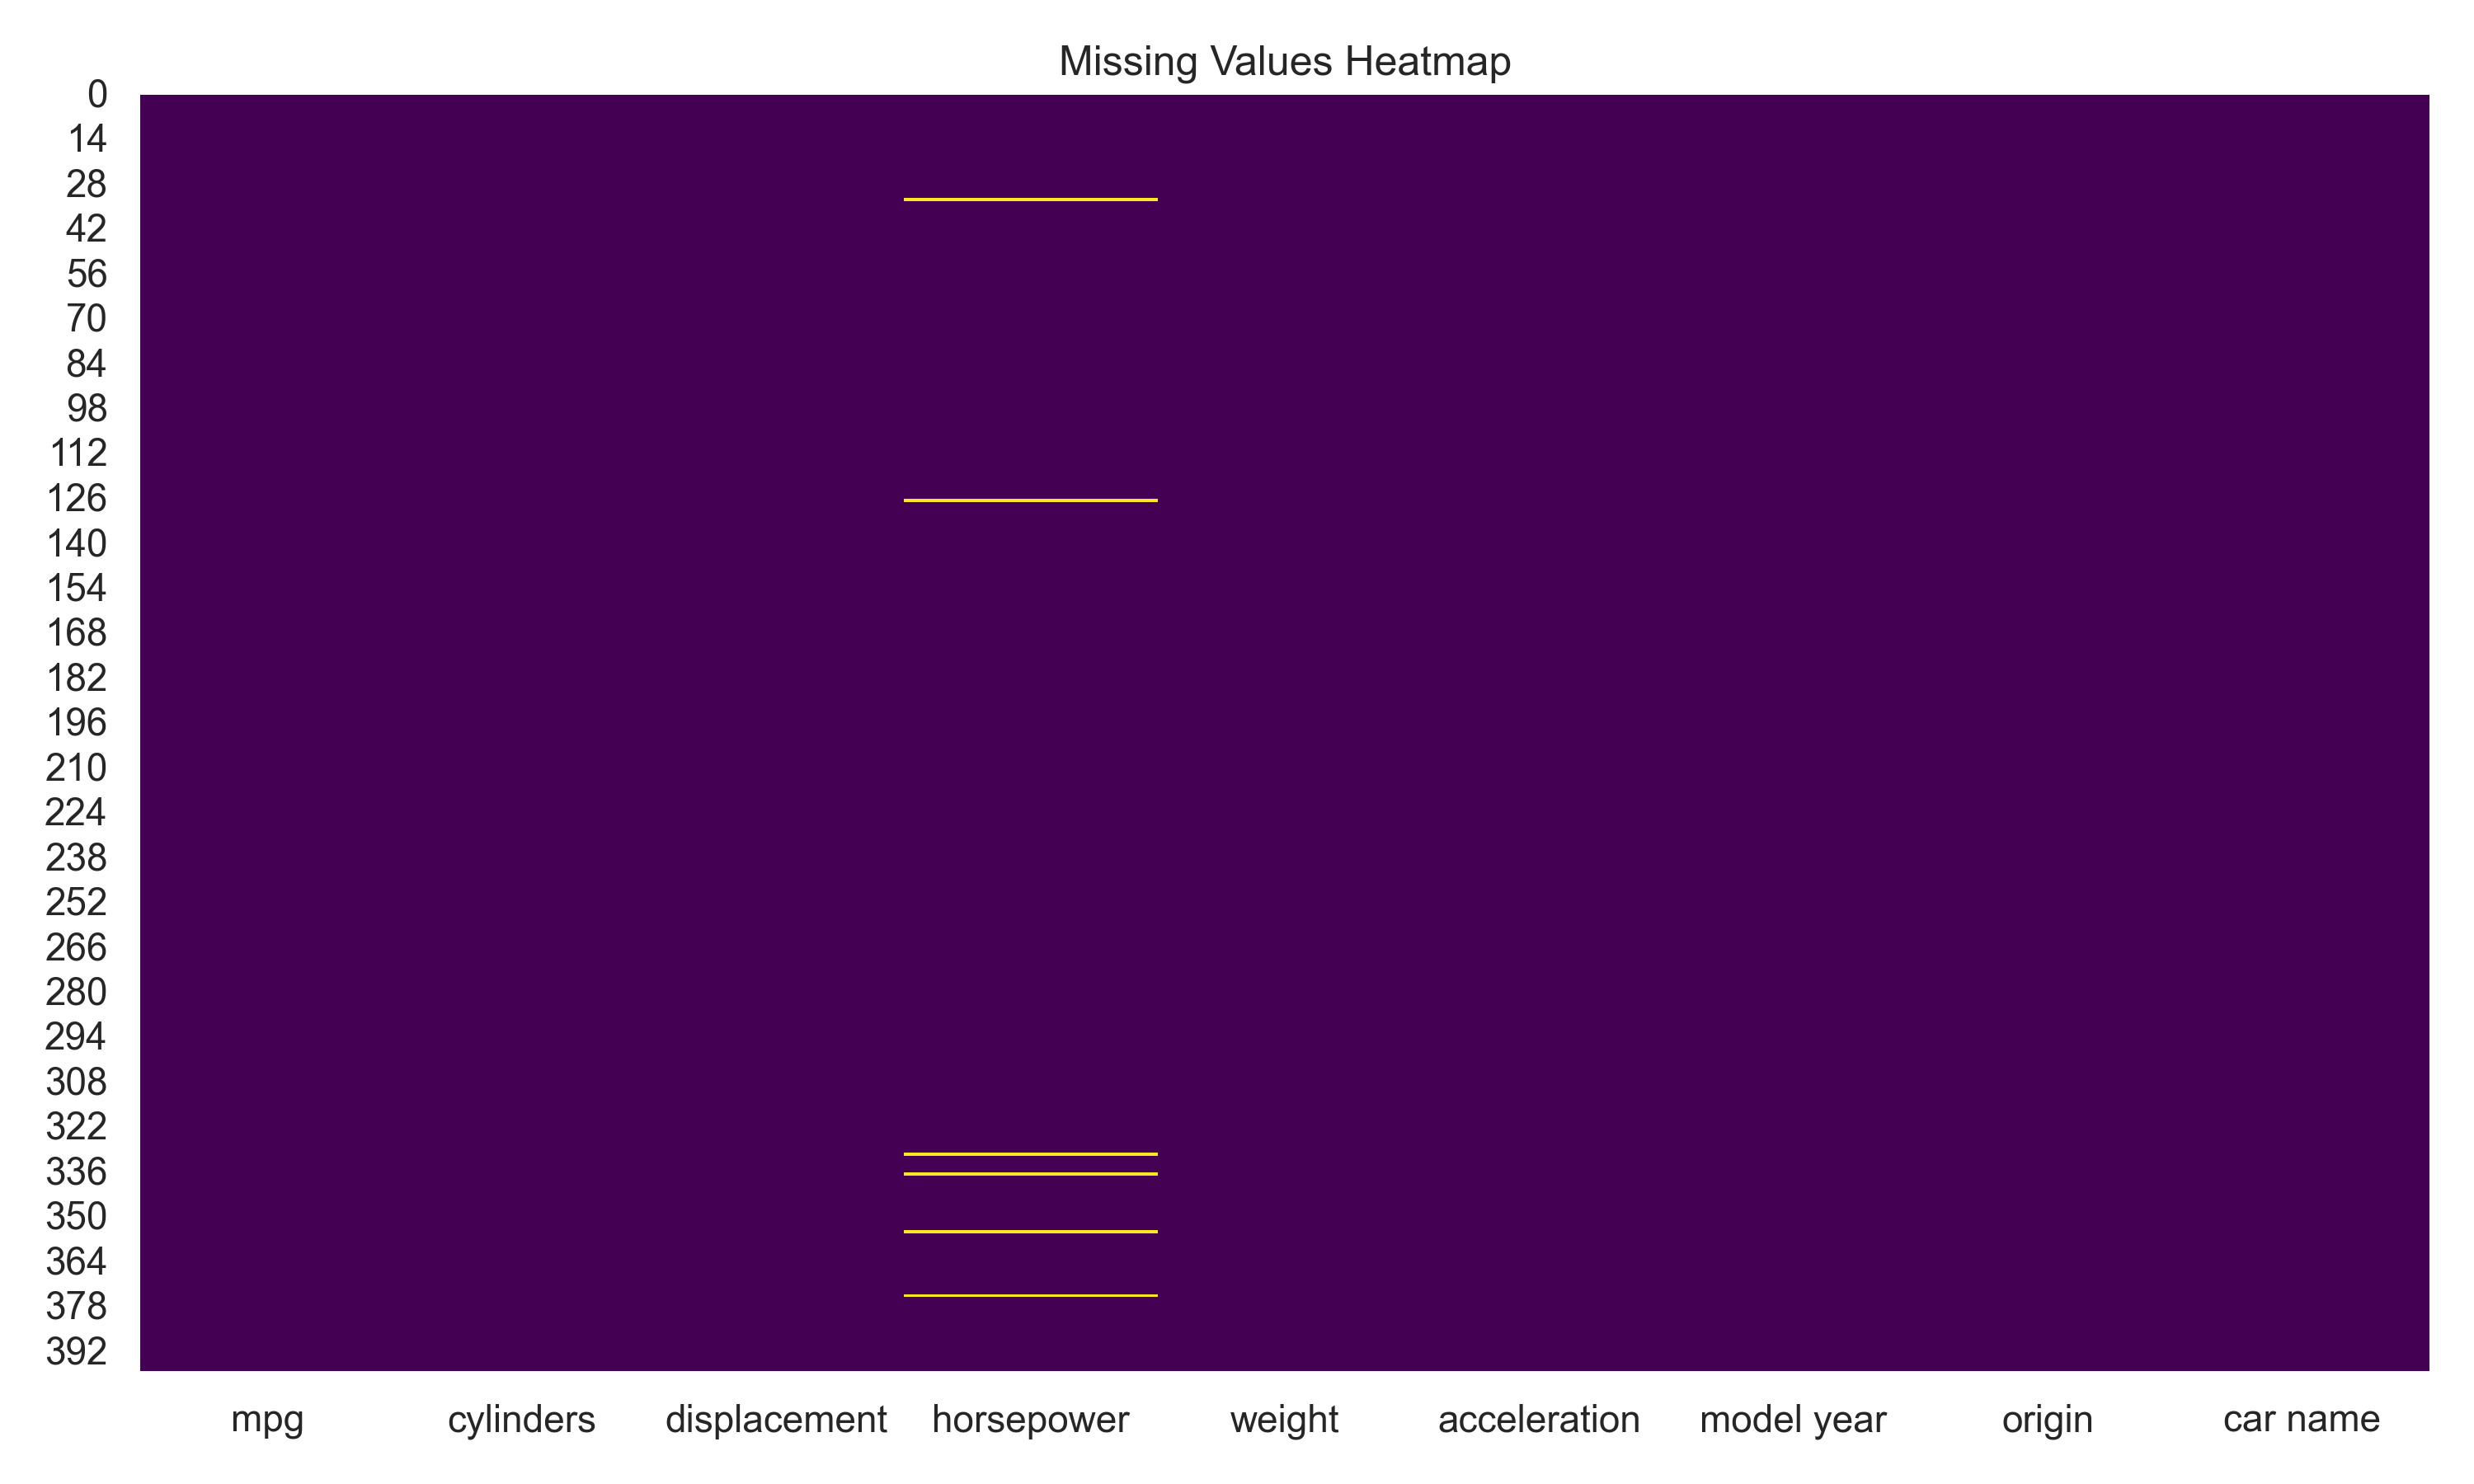 Missing values analysis
Statistical Analysis
Basic Statistics
# Calculate basic statistics
stats = df.describe()
print(stats)
Statistical analysis results
Visualization
Creating Visualizations
import matplotlib.pyplot as plt
import seaborn as sns
# Create correlation heatmap
plt.figure(figsize=(10, 8))
sns.heatmap(df.corr(), annot=True, cmap='coolwarm')
plt.title('Correlation Heatmap')
plt.show()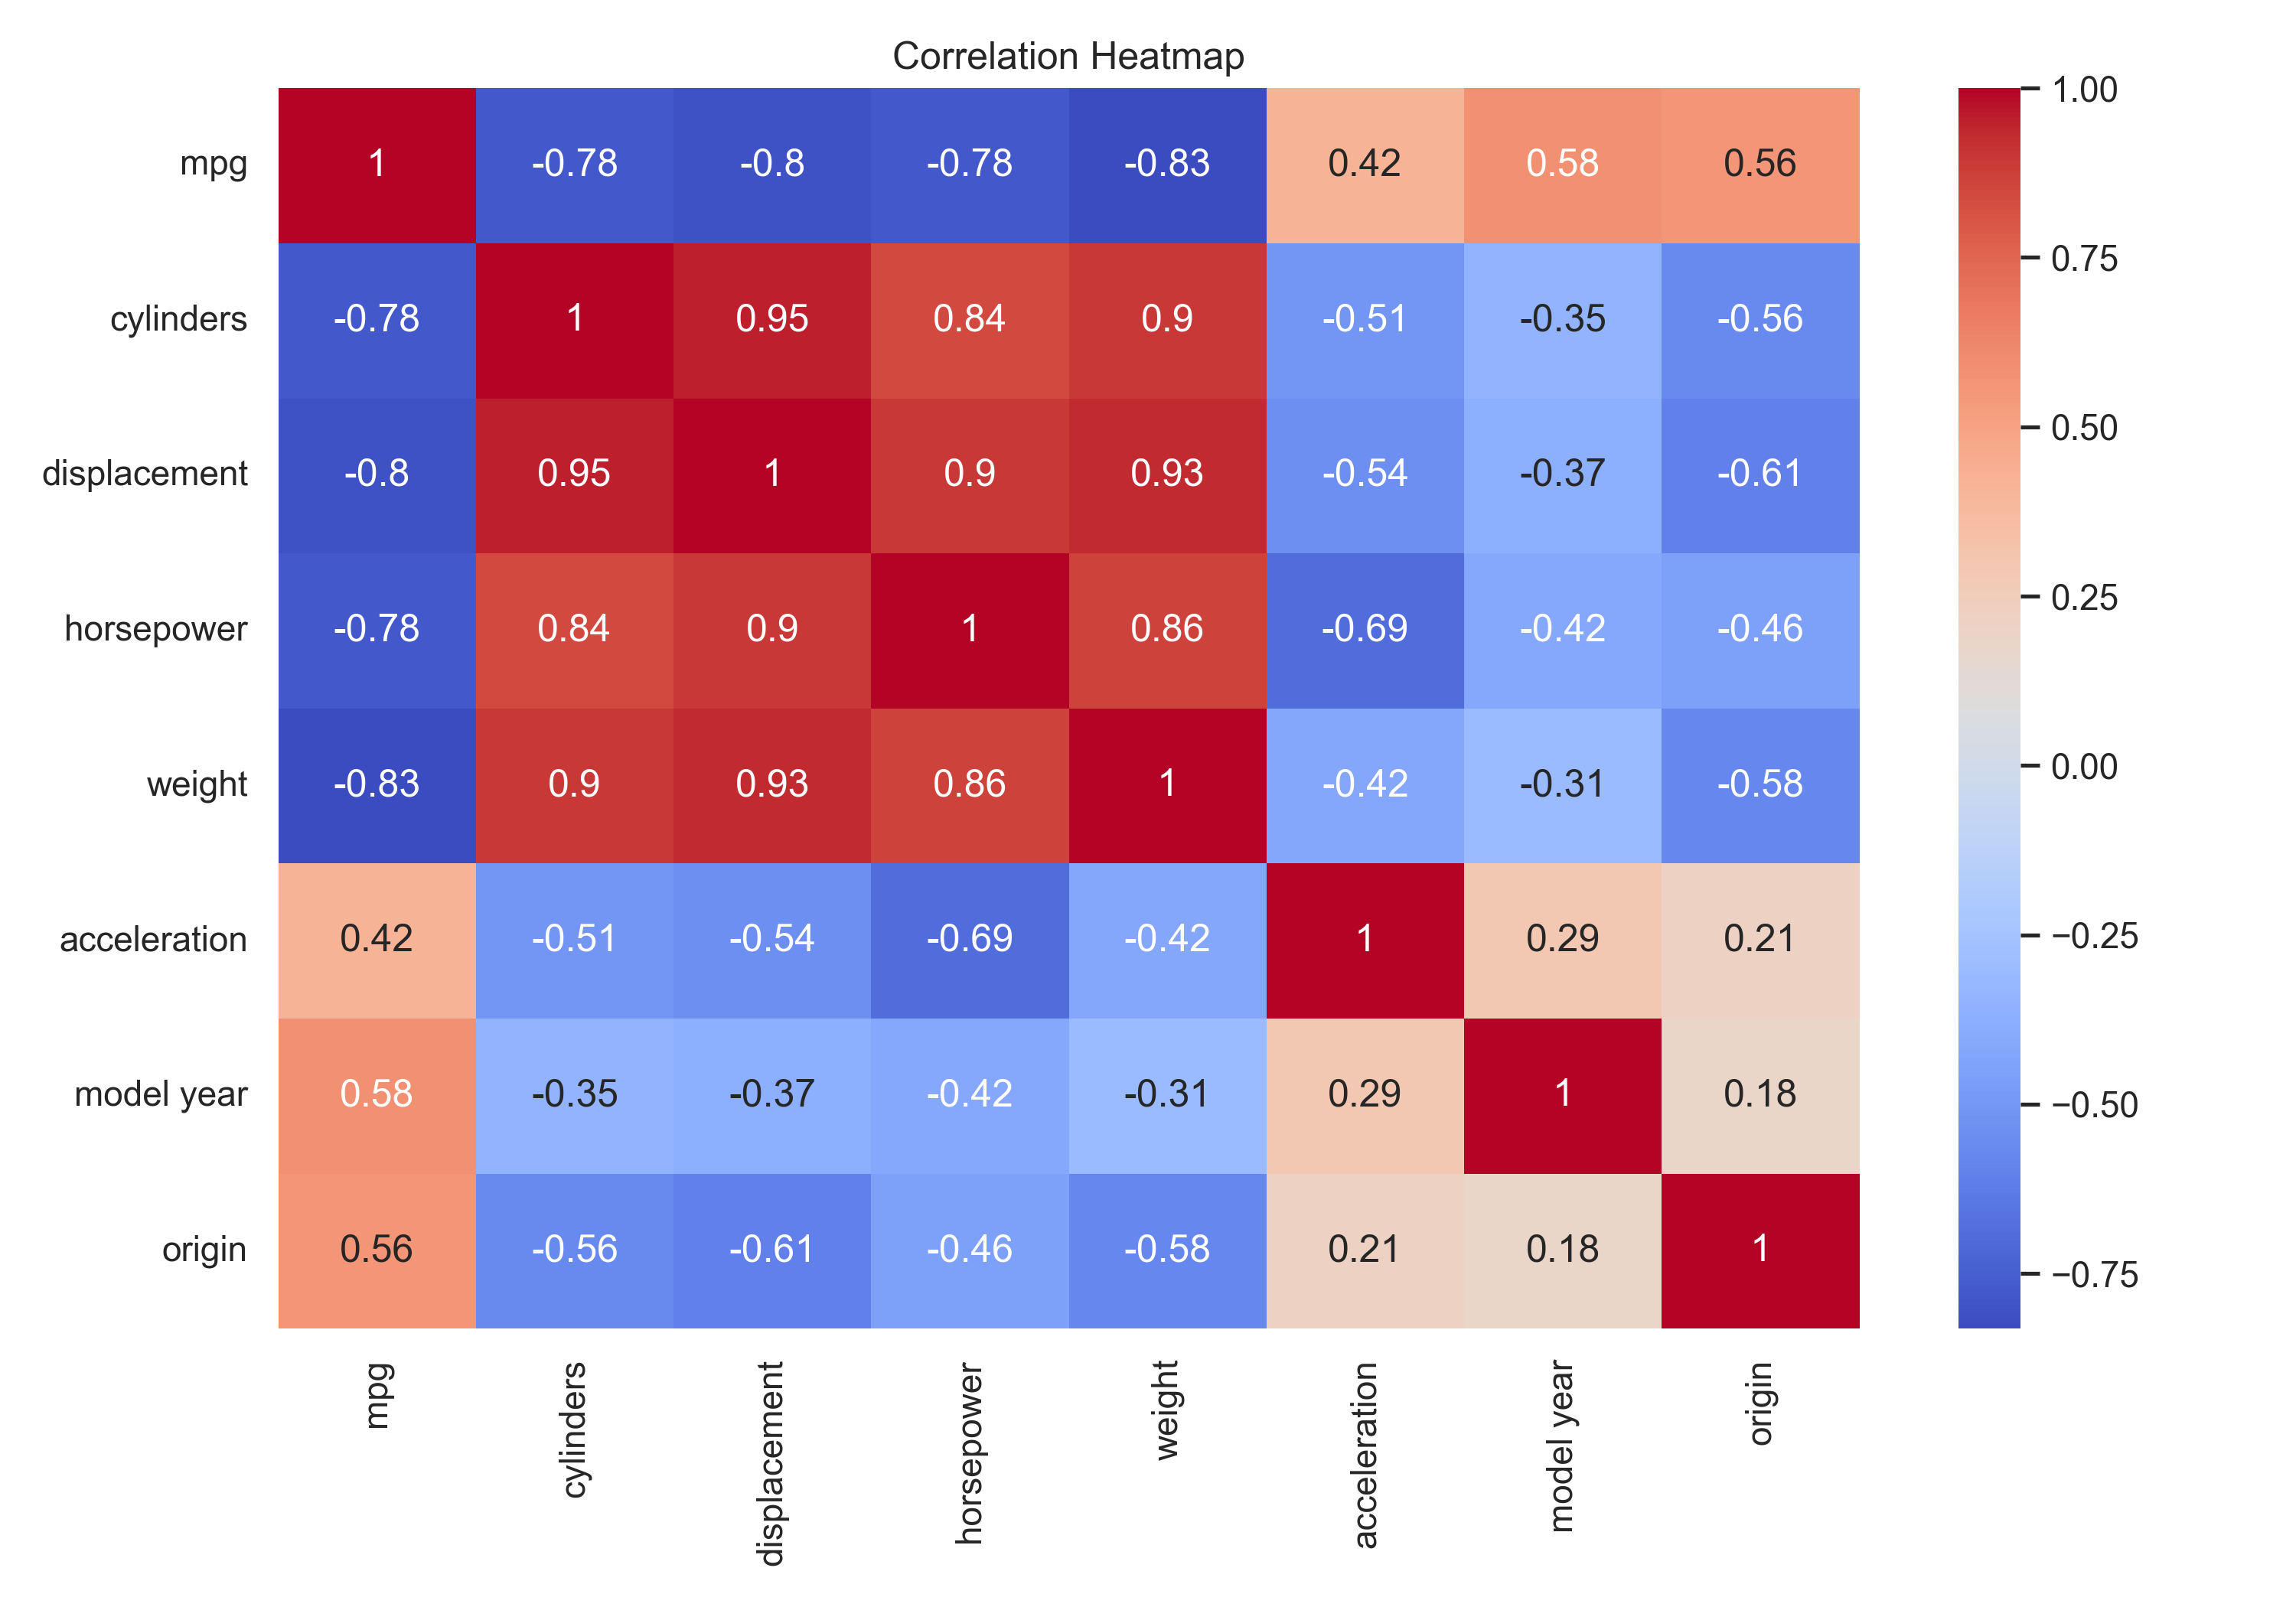 Correlation heatmap showing relationships between variables
Scatter Plots
# Create scatter plots
sns.pairplot(df[['mpg', 'cylinders', 'displacement', 'horsepower', 'weight']])
plt.show()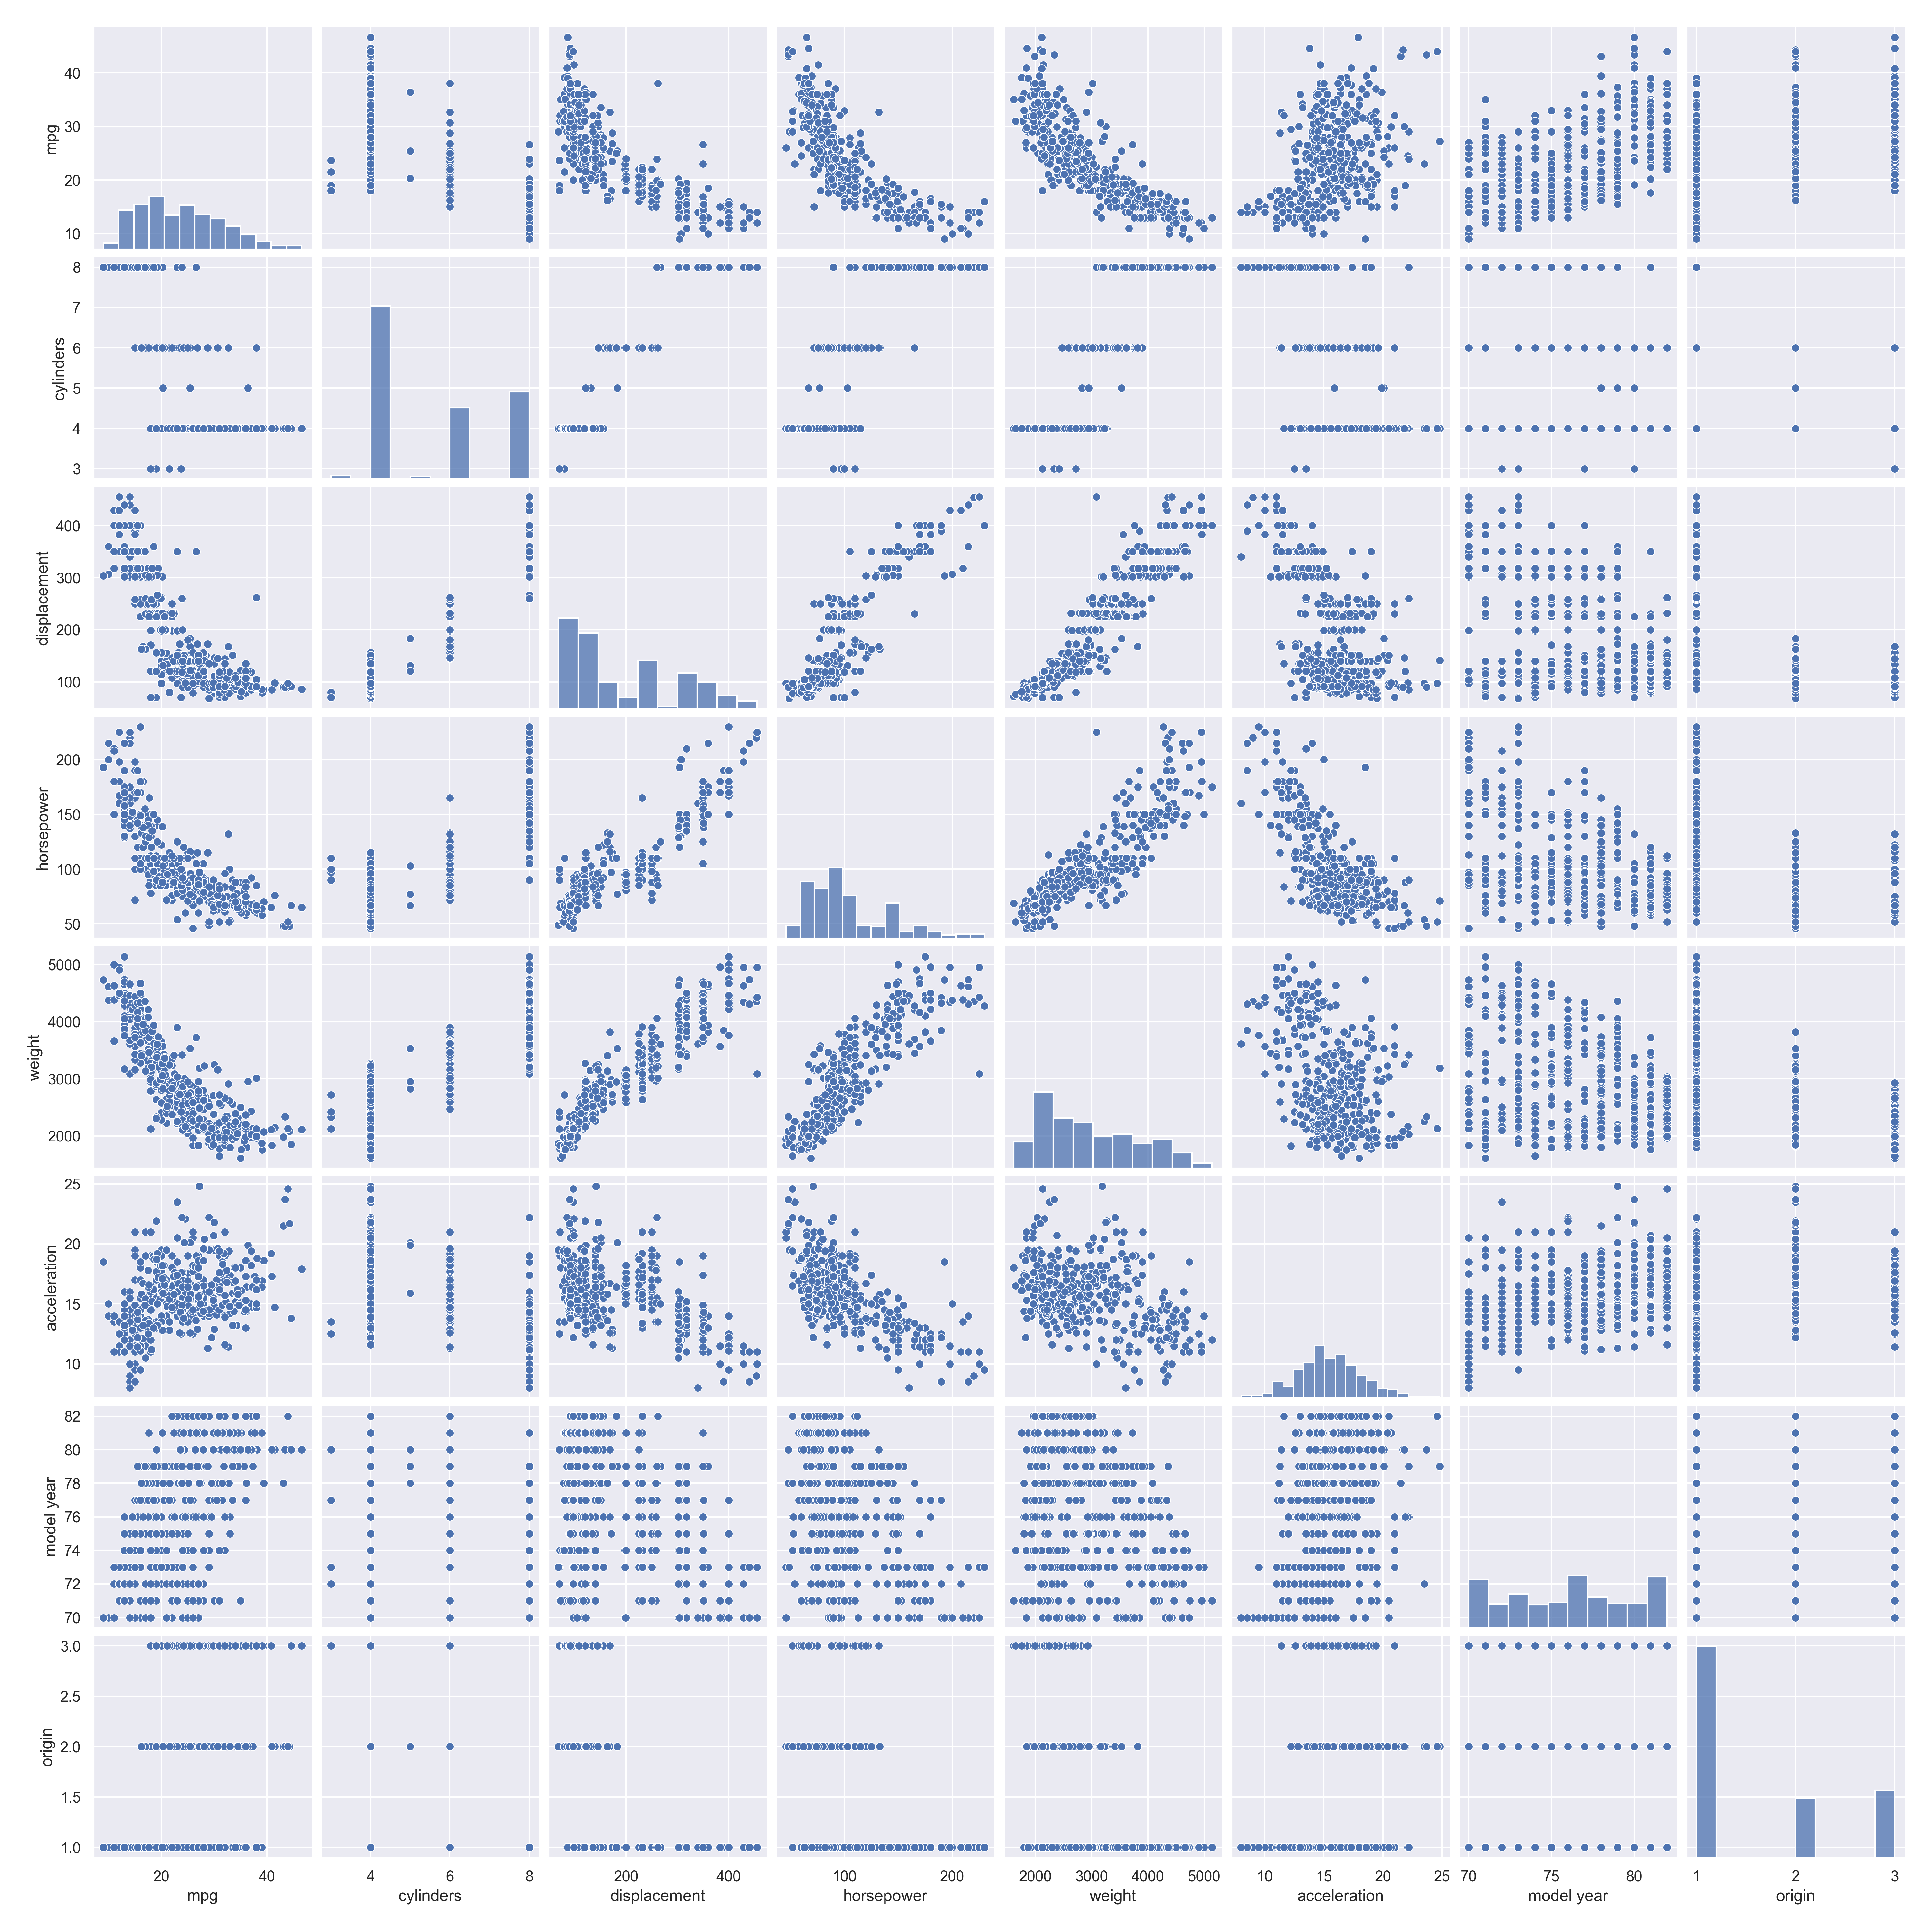 Scatter plots showing relationships between variables
Data Preprocessing
Handling Categorical Variables
# Convert categorical variables to numerical
df['origin'] = df['origin'].map({1: 'USA', 2: 'Europe', 3: 'Japan'})
df = pd.get_dummies(df, columns=['origin'])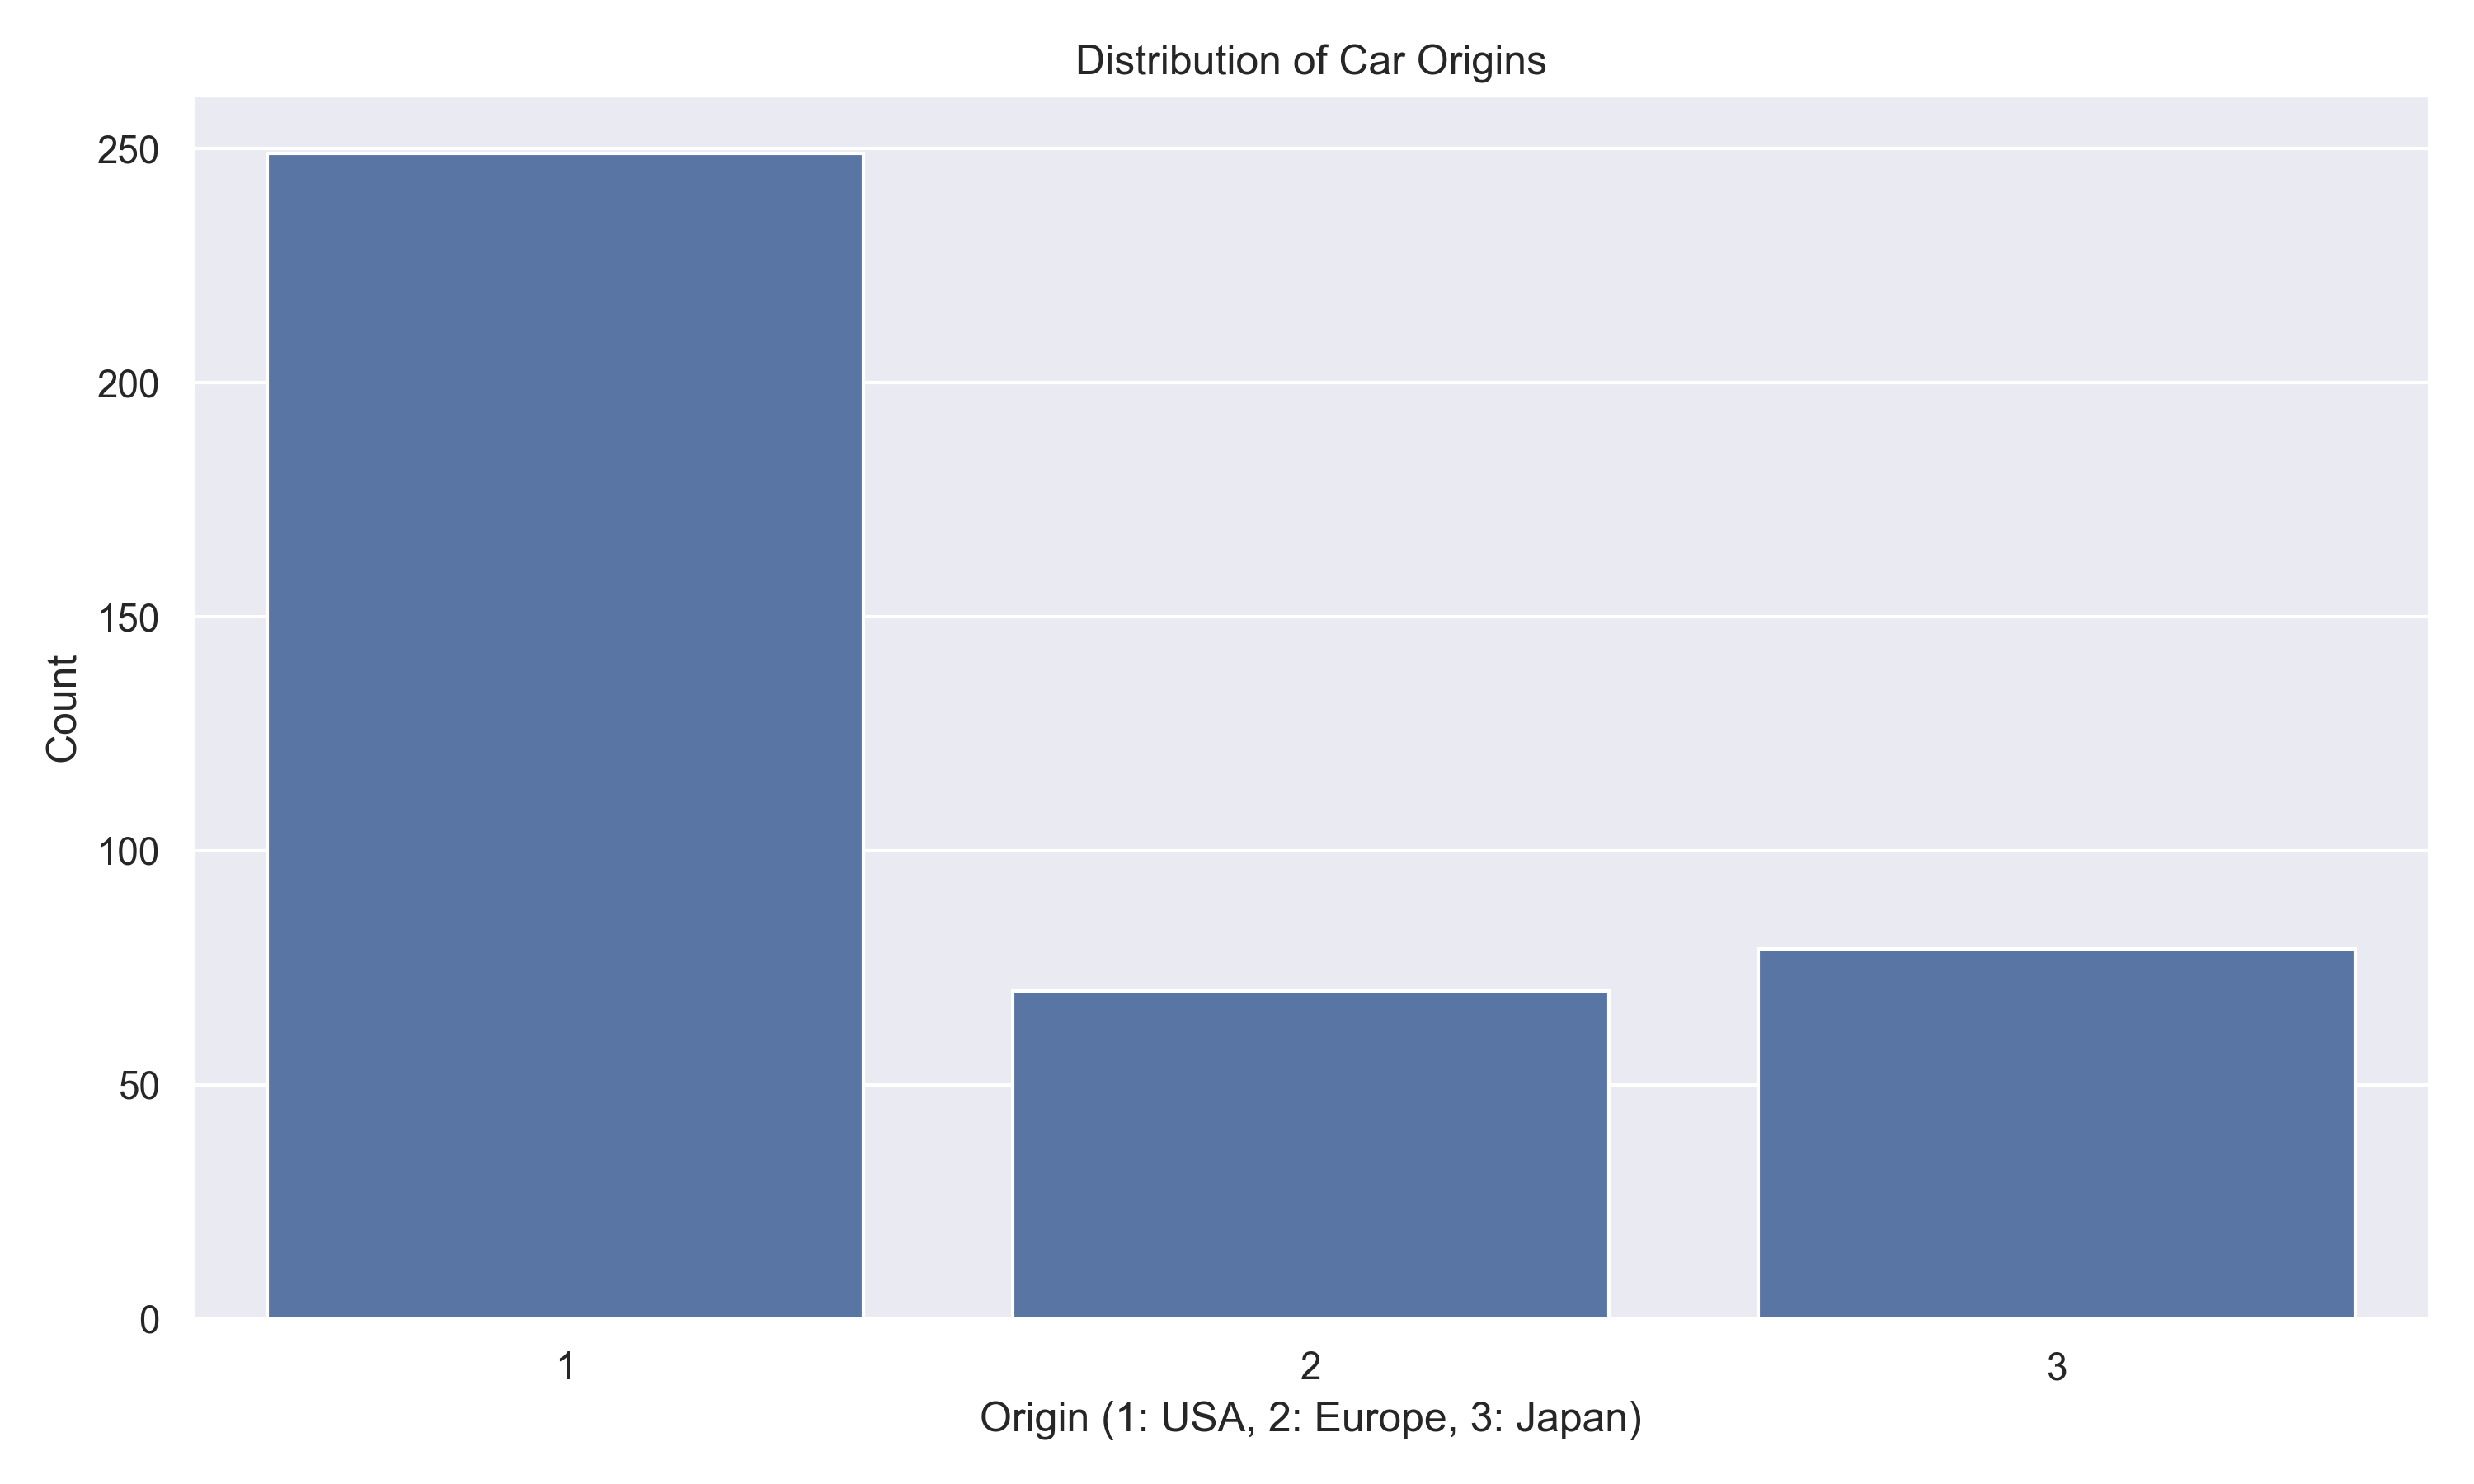 Dataset after preprocessing
Key Findings
- Missing values were found in the horsepower column, which were imputed using the median value.
- The dataset shows a strong negative correlation between mpg and weight, indicating that heavier cars tend to have lower fuel efficiency.
- Origin 3 (likely European cars) shows the highest average mpg, suggesting better fuel efficiency in European models.
- Later model years show a trend towards higher mpg values, indicating improvements in fuel efficiency over time.